Radio signal information overview
- 19 May 2025
- 3 Minutes to read
- Print
- DarkLight
- PDF
Radio signal information overview
- Updated on 19 May 2025
- 3 Minutes to read
- Print
- DarkLight
- PDF
Article summary
Did you find this summary helpful?
Thank you for your feedback!
Reconeyez cloud now offers improved radio signal information to users. For all detectors/sirens/keypads the 2.4 GHz zigbee signal quality with the bridge is displayed. For the bridge units, the mobile signal quality of the bridge itself is displayed.
Radio signal in the table view
Devices menu table view shows a summary of the radio information in the Signal column using a simple 4 bar signal icon (poor-OK-good-very good). Hovering over the Signal column will display more detailed radio information - radio routes showing the number of hops between the device and its bridge, and the last time when the radio info was updated. The simplified 4-bar signal indicator is calculated based on the more technical radio signal parameters that can be viewed in the device view. If any of these radio parameters are outside of the acceptable range, then the whole radio link is displayed as having reduced quality. As mentioned, the bridge displays the mobile signal quality, while all other device types display their 2.4 GHz signal quality with the bridge.

Devices menu table view offers a simplified radio signal overview of the whole device area.
Radio signal in the device view
The device view shows more detailed 2.4 GHz signal information under the new Analytics tab. Route and multihop info related to the chosen device is displayed in more detail, allowing the user to click on the device names to see the quality of each radio hop separately.
.png)
Detailed signal information in device view
In addition, the device view shows a more detailed 2.4 GHz radio signal history graph with the following advanced radio parameters history displayed.
1) RSSI - Received Signal Strength Indicator - usually indicating radio link distance or obstacles in dBm (< 70 dBm = excellent)
2) LQI - Link Quality Index - usually indicating radio interference in the area or obstacles (100 = excellent)
3) ETX - Expected Transmission Count - indicates the number of packet repetitions (10 = no repetition)

2.4 GHz technical parameters RSSI/LQI/ETX explained
FROM values indicate 2.4 GHz signal viewed FROM the detector/siren/keypad perspective and TO values indicate 2.4 GHz signal info viewed from the bridge perspective - TO the detector/siren/keypad. This helps to distinguish, with more precision, the source of radio interference or device antenna damage. As in most cases, the radio links FROM the detector to the bridge are more informational, then by default, only FROM values are enabled in this graph for simplicity. This shows the signal quality details from the detector to the bridge - the direction where all the alarm photos, which constitute the majority of uploaded data, are loaded.

Detector 2.4 GHz radio history showing RSSI/LQI/ETX info FROM detector and TO detector.
Bridge mobile signal information
The bridge view shows more detailed mobile signal quality info. Mobile signal quality is calculated based on the following two parameters. If either of them is below the threshold, then the 4-bar signal icon displays the worse parameter.
1) Mobile RSSI - Received Signal Strength Indicator - mobile signal strength in dBm (< 85 dBm = excellent)
2) BER - Bit Error Rate - mobile packet repetition rate in percentage (0-1% = excellent)
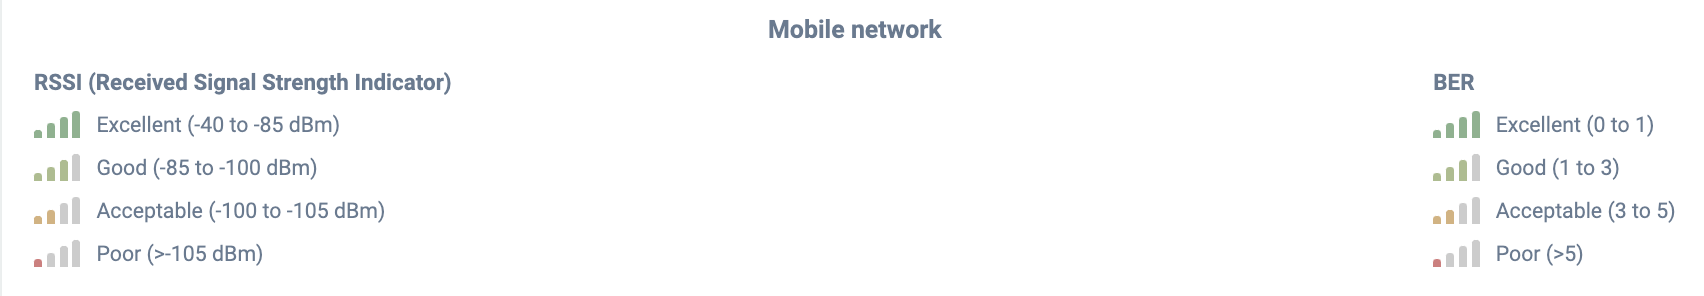
Mobile signal parameters explained
Interpreting 2.4 GHz signal parameters
Interpreting the combination of 2.4 GHz parameters
Parameter combination | Likely cause |
|---|---|
Low RSSI + Low LQI | Severe path loss due to distance, obstacles, or antenna misalignment |
Low RSSI + High ETX | Weak signal strength leads to frequent retransmissions. |
Low LQI + High ETX | High noise or interference causing packet corruption and retries |
Low RSSI + Low LQI + High ETX | Severe environmental or interference issues, poor device placement, or network congestion |
Good RSSI + Low LQI | High interference or multipath fading causes corrupted packets |
Good RSSI + High ETX | Possible congestion, routing inefficiencies, or packet collisions |
Good RSSI + Good LQI + High ETX | Overloaded network, too many retransmissions due to congestion |
Was this article helpful?